 Tatsuya Abe
Introduction
A pentest AI agent is not software that you build once and leave alone. Its performance improves by continuously finding failures and cost imbalances in execution logs and feeding those findings back into the next implementation change.
At Layer8, telemetry is product infrastructure. It directly affects how quickly we can improve our pentest AI agent.
Over the past year, our log analysis workflow moved from an LLMOps SaaS to Google Sheets, and then to a custom telemetry platform.
This post covers why we made that transition and the design we use today:
- A domain-specific monitoring dashboard for humans
- Raw SQL access for coding AI agents
Why We Needed a Telemetry Platform
Pentesting tends to involve complex execution flows and a large amount of practitioner judgment. The target workflow itself has to be shaped through trial and error, and the requirements for log analysis change along the way.
Our pentest AI agent has the following characteristics:
- Long-running: one session can run continuously for several hours
- Multi-agent: multiple agents collaborate while calling multiple tools
- Exploratory: the next action is dynamically decided based on the latest facts
- High-cost: strong models are called frequently, which increases cost
Because there are many things to tune, being able to inspect a single session in detail is not enough. We need to continuously answer questions such as:
- Which phase / agent / tool is becoming a bottleneck across sessions?
- Which types of findings are discovered from which attempt patterns?
- Where are cost and token usage concentrated?
- How should analysis results be connected to the next implementation change?
This does not mean that building a custom platform from the beginning would have been the right choice. We changed our log analysis approach as the product matured: first an LLMOps SaaS, then Google Sheets, and finally a custom platform.
Why We Started with an LLMOps SaaS
If you are building an AI agent today, we recommend starting with an LLMOps SaaS. In the early stage, the agent design itself is still fluid, and telemetry infrastructure is usually not where engineering time should go first.
In our case, we decided to build a custom platform only after we had a reasonable expectation that large breaking changes would become less frequent. It took more than six months of incremental product development to reach that point.
An LLMOps SaaS is useful for inspecting individual sessions.
However, our pentest AI agent needs cross-session statistics, tables and graphs specific to our custom tools, and cost bottleneck analysis. We concluded that a general-purpose LLMOps SaaS alone would not be enough for those needs.
The Limits We Hit with Google Sheets
One strong need was to get a broad view of different types of logs. We tried Google Sheets next for a few reasons:
- Avoid spending engineering effort on a custom platform too early
- View multiple types of logs in a tabular format
- Complete a certain amount of analysis directly in Sheets with macros and Gemini
- Keep the schema loose enough to try breaking changes in the pentest AI agent
Google Sheets worked better than expected and contributed significantly to tuning. During this period, we did not use it alongside an LLMOps SaaS; we analyzed everything in Google Sheets. Scanning raw tool call logs in a spreadsheet made it easy to understand overall trends and issues.
On the other hand, deeper investigation increasingly required manual filters and moving back and forth across multiple sheets. The same manual steps started to repeat for every analysis. The issue became clear: the information was there, but reaching it was painful. By that point, the structure of the pentest AI agent had mostly stabilized, and we judged that it was time to build a custom platform for more detailed tuning.
Building a Custom Improvement Loop
When we made this decision, large breaking changes to the pentest AI agent itself were expected to become less frequent. Still, changes would not disappear, so we needed to handle change tolerance at the architecture level. The custom platform we operate today is designed with that assumption. The important points are to store raw logs flexibly, provide the right interface for each reader, and connect analysis results back into an improvement loop.
Architecture Overview
---
config:
  layout: dagre
  theme: base
---
flowchart LR
%% Producer
  subgraph Producer["Producer"]
    AG["Pentest AI Agent"]
  end

%% BigQuery
  subgraph BQStorage["BigQuery"]
    direction TB
    LAKE[("Data Lake")]
    MV[("Materialized Views<br/>(read-optimized)")]
    LAKE --> MV
  end

%% Consumers
  subgraph Consumers["Consumers"]
    direction TB
    UI["Monitoring Dashboard"]
    SQL["Raw SQL Access"]
  end

  H(("Human"))
  AGT(("Coding AI Agent"))
  PR{{"Improvement Proposal"}}
  AG -- log --> LAKE
  MV --> UI
  MV --> SQL
  LAKE --> SQL
  UI -. read .-> H
  SQL -. read .-> AGT
  AGT --> PR
  PR -. feedback .-> AG
%% Style
  style AG fill: #eef6ff, stroke: #007bff, stroke-width: 2px
  style Producer fill: #ffffff, stroke: #007bff, stroke-width: 2px, stroke-dasharray: 5 5
  style BQStorage fill: #f8f9ff, stroke: #5c6bc0, stroke-width: 2px
  style LAKE fill: #ffffff, stroke: #5c6bc0, stroke-width: 1px
  style MV fill: #ffffff, stroke: #5c6bc0, stroke-width: 1px
  style Consumers fill: #fffaf0, stroke: #fb8c00, stroke-width: 2px
  style UI fill: #ffffff, stroke: #fb8c00, stroke-width: 1px
  style SQL fill: #ffffff, stroke: #fb8c00, stroke-width: 1px
  style H fill: #f8f9fa, stroke: #212529, stroke-width: 2px
  style AGT fill: #f8f9fa, stroke: #212529, stroke-width: 2px
  style PR fill: #e8f5e9, stroke: #4caf50, stroke-width: 2px
The architecture has three main components. Producer is the pentest AI agent, which writes logs generated during execution, such as LLM calls, tool calls, and finding detection. BigQuery has two layers: a Data Lake for raw logs and Materialized Views (MVs) shaped for readers. Consumers are split into two paths: humans through the monitoring dashboard, and coding AI agents through raw SQL access. The latter forms the improvement loop.
The following sections walk through the main design decisions.
Schema Design: Semi-Structured Logs and MVs
The base table is a simple append-only log with fixed columns and a JSON payload.
CREATE TABLE pentest_events (
  timestamp        TIMESTAMP,
  session_id       STRING,
  event_type       STRING,
  payload          JSON,    -- semi-structured payload
  ...
)
PARTITION BY DAY(timestamp)
CLUSTER BY (session_id, event_type);
payload contains a different structure for each log type. For an LLM call, it may contain token counts, model name, cache hit information, and so on. For a tool call, it may contain the tool name and arguments. For a finding, it may contain vulnerability information.
We keep the payload schema loose because the output from the pentest AI agent will continue to change. New fields will be added, and existing field names may change. If the base table schema is too strict, changes in the pentest AI agent become coupled to the telemetry platform. What we learned from the Google Sheets phase was the importance of not taking away flexibility from the writer, the pentest AI agent. We carried that lesson into this design.
Instead, MVs handle read-side optimization and schema differences.
-- Example: MV for LLM calls (excerpt)
CREATE MATERIALIZED VIEW pentest.mv_llm_calls AS
SELECT
  session_id,
  timestamp                                                   AS event_at,
  JSON_VALUE(payload, '$.agent_name')                         AS agent_name,
  JSON_VALUE(payload, '$.model')                              AS model,
  CAST(JSON_VALUE(payload, '$.input_tokens')           AS INT64) AS input_tokens,
  CAST(JSON_VALUE(payload, '$.output_tokens')          AS INT64) AS output_tokens,
  CAST(JSON_VALUE(payload, '$.cached_input_tokens')    AS INT64) AS cached_input_tokens,
  CAST(JSON_VALUE(payload, '$.thoughts_tokens')        AS INT64) AS thoughts_tokens,
  CAST(JSON_VALUE(payload, '$.tool_use_prompt_tokens') AS INT64) AS tool_use_prompt_tokens
FROM `pentest.pentest_events`
WHERE event_type = 'llm_response';
This design has two benefits:
- After JSON extraction, consumers read lightweight scalar columns, which greatly reduces query scan volume
- Schema differences, such as newly added fields or deprecated fields, can be absorbed in MV definitions, so the pentest AI agent does not need to be constrained by compatibility with older log schemas
The goal is to give the writer, the pentest AI agent, the flexibility of a Data Lake while giving readers, such as the UI and analysis workflows, the speed of scalar columns.
Interface Design: UI for Humans, Raw SQL for Coding AI Agents
The two readers, humans and coding AI agents, need different interfaces. We provide fixed-query UI for humans and raw SQL access for coding AI agents.
We chose not to expose predefined queries as MCP tools. Preparing shared queries would allow both humans and coding AI agents to ask the same questions, but it would reduce the freedom of coding AI agents to formulate their own questions.
---
config:
  layout: dagre
  theme: base
---
flowchart TB
  BQ[(BigQuery)] --> RA["Read Layer"]
  RA --> UI["Monitoring Dashboard<br/>fixed queries + drill-down"]
  RA --> SQL["Raw SQL Access<br/>(BigQuery API)"]
  UI --> H(("Human<br/>routine monitoring"))
  SQL --> AG(("Coding AI Agent<br/>improvement proposals / troubleshooting"))
  DROP["MCP tool<br/>predefined queries"]:::dropped
  classDef dropped stroke-dasharray: 5 5, stroke: #999, color: #999, fill: #f5f5f5
  style BQ fill: #f8f9ff, stroke: #5c6bc0, stroke-width: 2px
  style RA fill: #ffffff, stroke: #5c6bc0, stroke-width: 1px
  style UI fill: #fffaf0, stroke: #fb8c00, stroke-width: 2px
  style SQL fill: #fffaf0, stroke: #fb8c00, stroke-width: 2px
  style H fill: #f8f9fa, stroke: #212529, stroke-width: 2px
  style AG fill: #eef6ff, stroke: #007bff, stroke-width: 2px
Each consumer maps to a different use case and interface:
| consumer | Main use case | Best interface |
|---|---|---|
| Human | Routine monitoring + expected drill-downs | Fixed queries + UI components |
| Coding AI Agent | Improvement proposals / troubleshooting | Raw access that can write arbitrary SQL |
This asymmetric design gives humans a screen optimized for routine monitoring while preserving room for coding AI agents to ask a different question each time.
Monitoring Dashboard Design
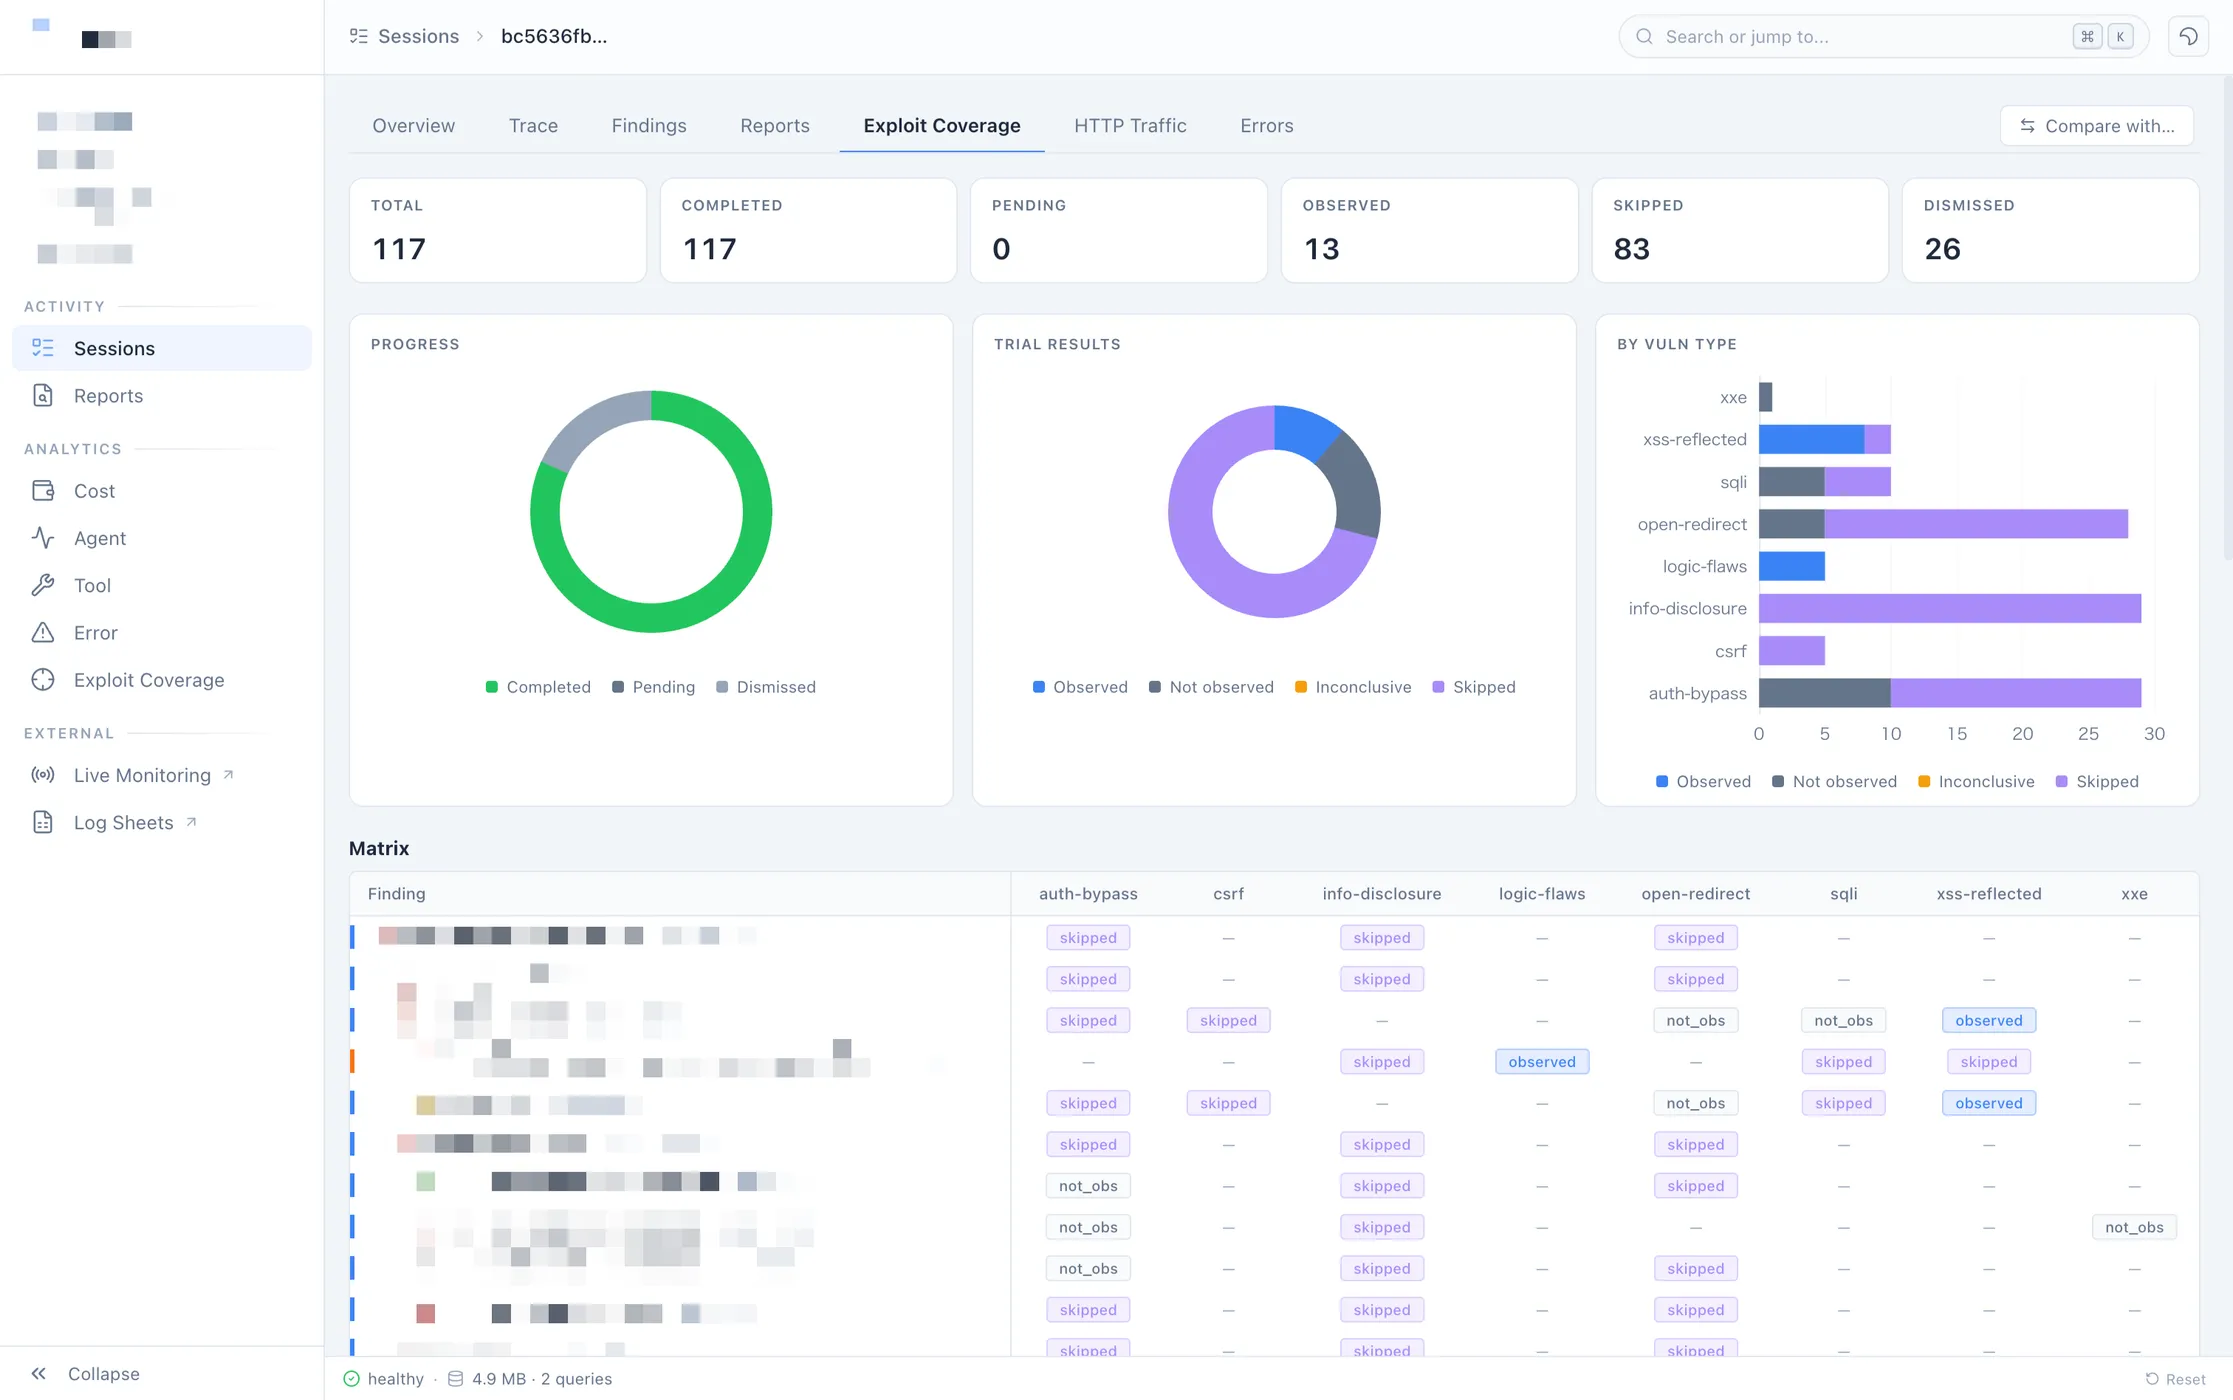
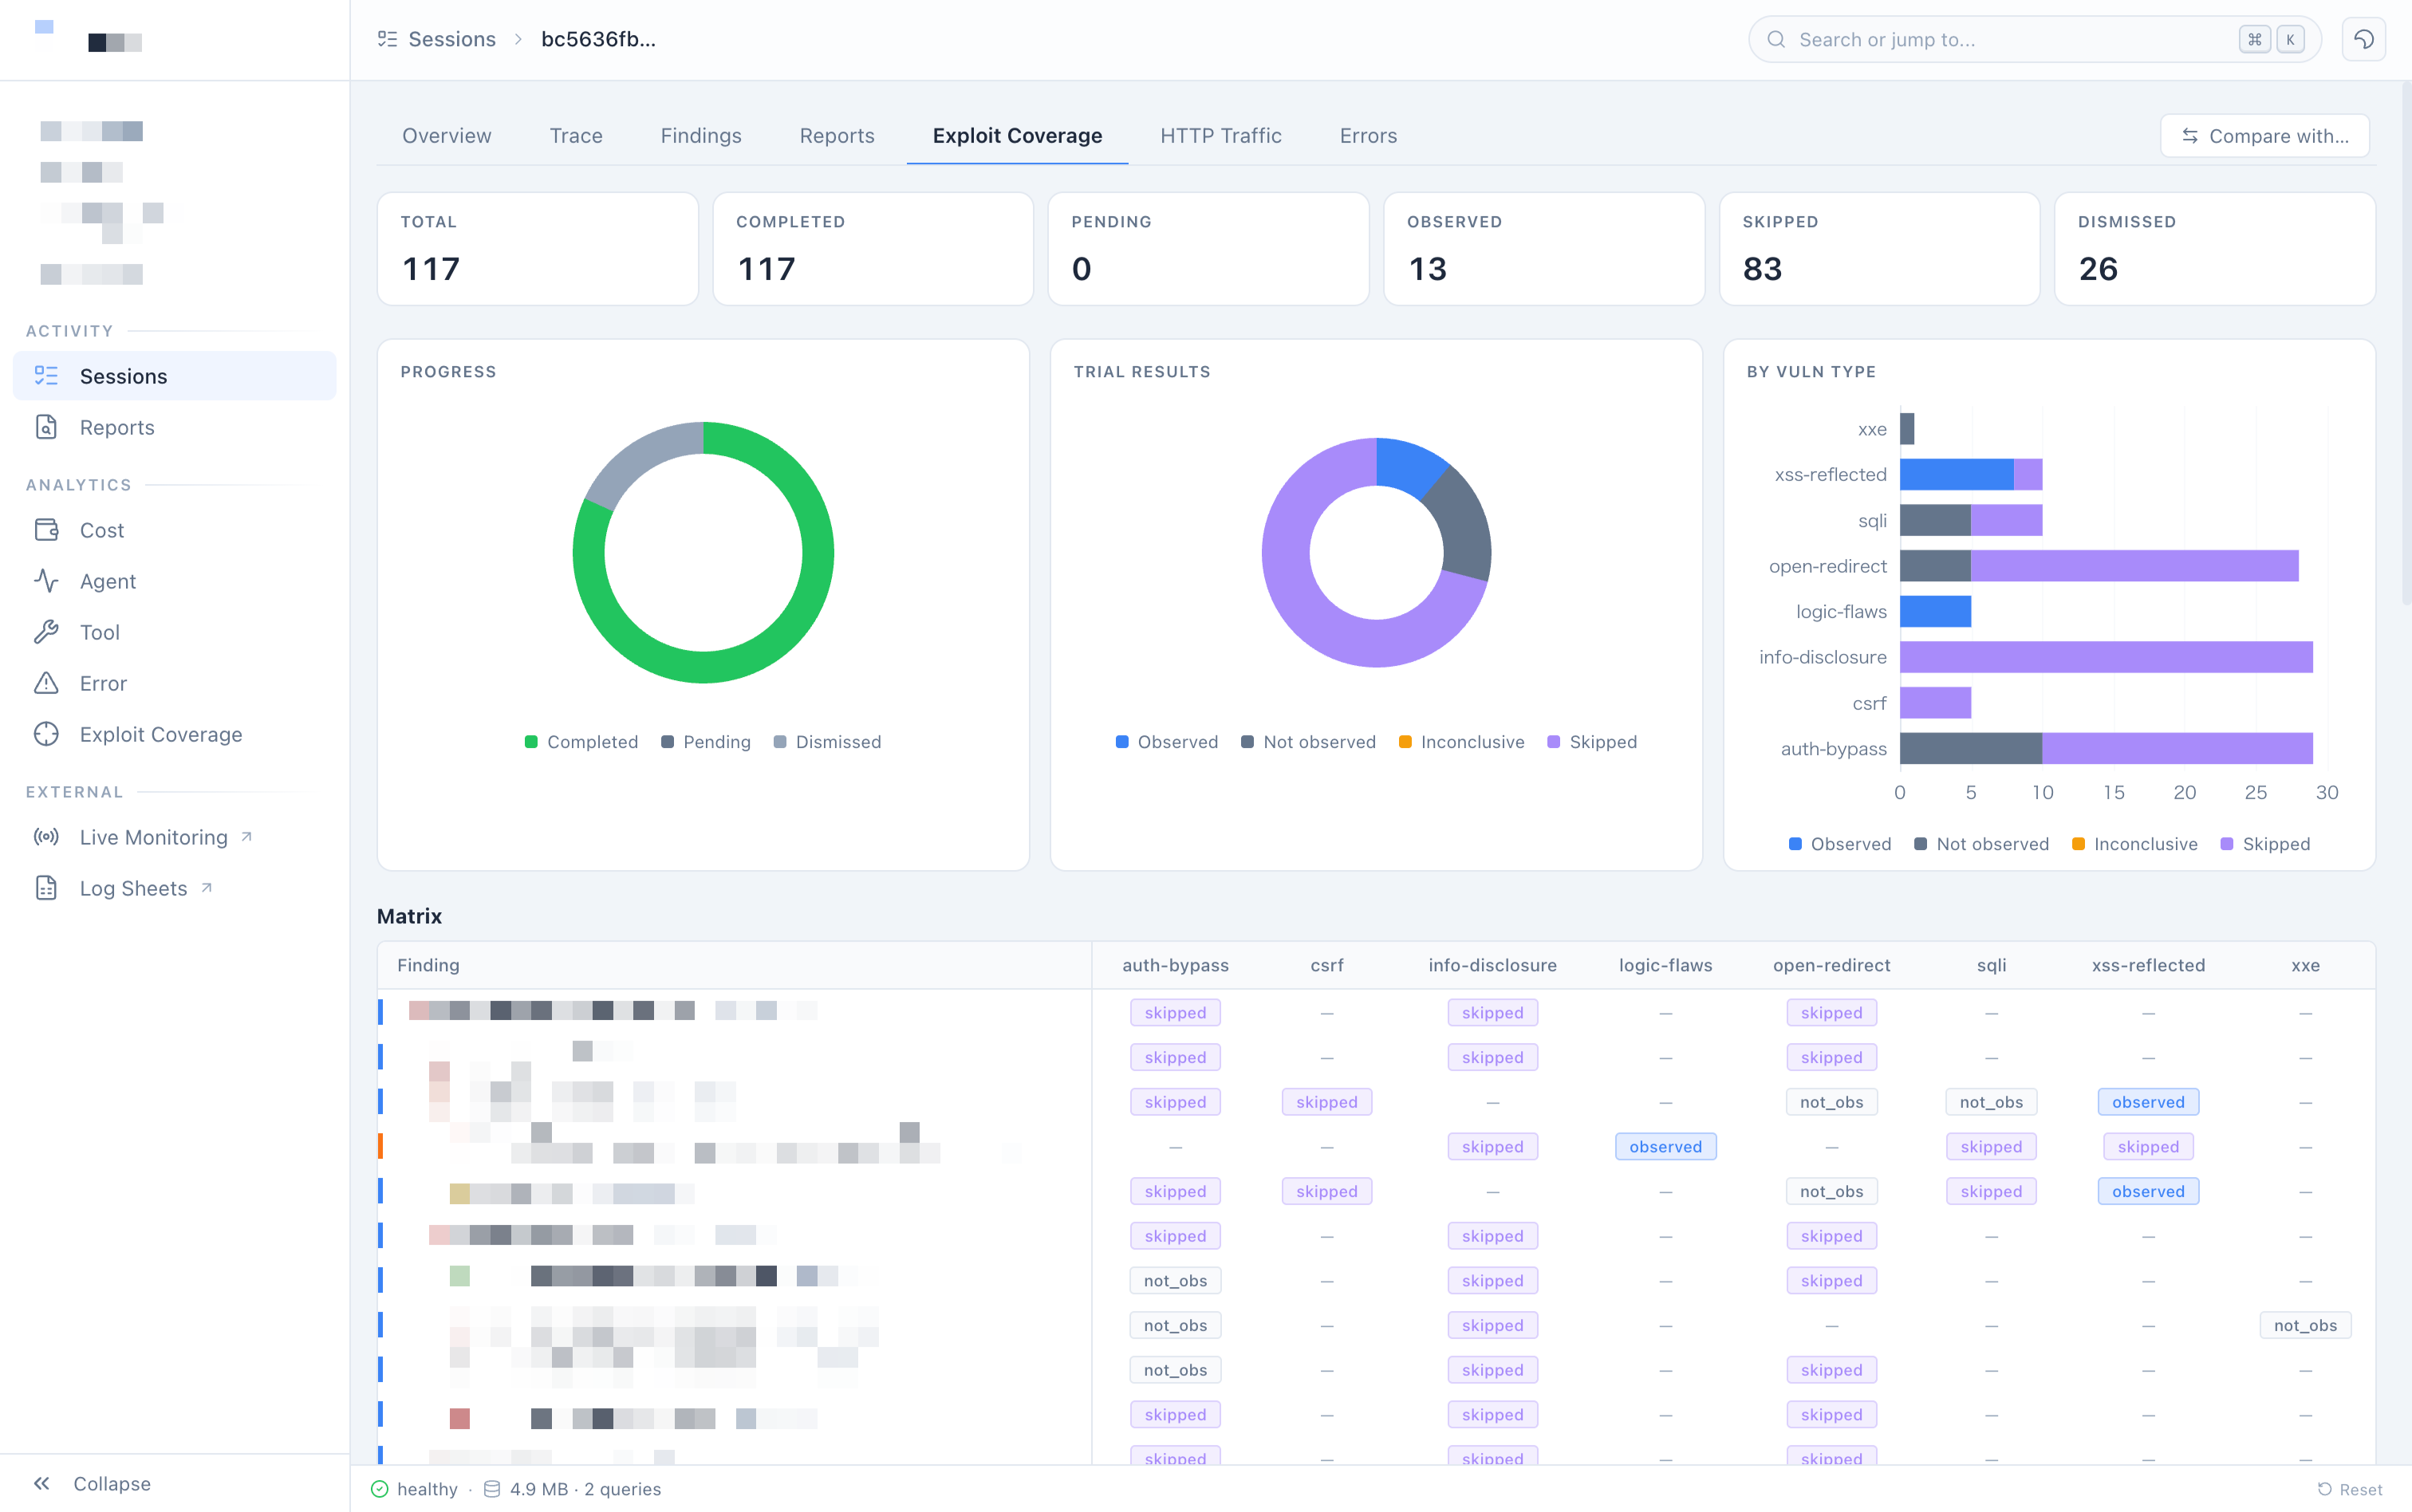
The monitoring dashboard is not a general-purpose dashboard for viewing everything. Its screen structure is opinionated around the pentest workflow.
The specific telemetry data we collect and the detailed screen structure of the monitoring dashboard are not disclosed, as they relate to the internal design and evaluation criteria of our pentest AI agent.
The following is an example of the monitoring dashboard we currently operate.
Telemetry Analysis by Coding AI Agents
The main payoff of this asymmetric design is that coding AI agents can read telemetry from the pentest AI agent and run the improvement loop. This is more than analysis automation; it is the development workflow for continuously improving the pentest AI agent.
We maintain analysis-oriented Agent Skills for coding AI agents. For example, a cost analysis Skill completes the following flow in one session:
- Analyze telemetry directly with SQL
- Aggregate cost and token usage trends by agent / model / tool
- Identify sessions with unusually high cost or token usage, then drill down into tool results
- Identify bottlenecks and produce improvement proposals for the pentest AI agent
Agent Skills describe what each table contains, what SQL to write, and how to map analysis results to hypotheses and countermeasures. Coding AI agents load the necessary Skills and proceed autonomously.
---
config:
  layout: dagre
  theme: base
---
flowchart LR
  AG["Pentest AI Agent execution"] -- telemetry --> BQ[(BigQuery)]
  BQ -- "Agent Skills" --> INV["Coding AI Agent<br/>validates hypotheses with SQL"]
  INV --> HYP["Identify bottlenecks"]
  HYP --> PR{{"Improvement Proposal"}}
  PR -. feedback .-> AG
  style AG fill: #eef6ff, stroke: #007bff, stroke-width: 2px
  style BQ fill: #f8f9ff, stroke: #5c6bc0, stroke-width: 2px
  style INV fill: #ffffff, stroke: #fb8c00, stroke-width: 2px
  style HYP fill: #fff5f5, stroke: #f44336, stroke-width: 2px
  style PR fill: #e8f5e9, stroke: #4caf50, stroke-width: 2px
This loop requires three things:
- Coding AI agents can write arbitrary SQL (= questions are not constrained by MCP tools)
- The schema can be read in a stable way (= schema differences are absorbed by MVs)
- Domain knowledge is codified as Agent Skills (= domain-specific rather than general-purpose)
These correspond to the three design decisions described above. This loop is already running in practice, and it has made it easier for a small team to maintain a steady improvement cycle.
Conclusion
For our pentest AI agent, we moved our log analysis workflow from an LLMOps SaaS to Google Sheets, and then to a custom platform. We do not think we should have built a custom platform from the beginning. The right choice changed as we kept asking what analysis capability the product needed at each phase, and how much platform-building cost was worth paying.
Another reason we could build this custom platform was the progress of coding AI agents. The development and operational cost of custom tools has fallen significantly, and building a custom platform — once a heavy decision — is no longer such a high bar. Even after accounting for development and operation, analysis and tuning are faster than before.
LLMOps SaaS products are not the problem. General-purpose tools for AI agents were simply not enough to provide a monitoring experience specialized for a domain-specific workflow such as pentesting.
To keep improving a pentest AI agent, it is not enough for humans to look at execution logs. For humans, the screens should narrow attention to what matters. For coding AI agents, raw access should allow them to formulate their own questions. The result then needs to connect back to the next implementation change. The telemetry platform described in this post is one example of designing that full improvement loop.